En agile Scrum ou Kanban, un des besoins fondamentaux est de mesurer les performances. Jira Software propose une fonctionnalité pertinente : les rapports. En effet, l’Inspection, c’est-à-dire la mesure d’un certain nombre d’indicateurs ou de métriques est un des trois piliers de la méthode agile (à lire aussi les articles sur les mesures de l’agilité).
Jira propose des rapports intégrés mais peu de gens les utilisent faute de les maîtriser.
Et pourtant, les rapports Jira contiennent des informations précieuses et même indispensables pour les équipes. Et vous pouvez tout à fait accéder à ces données. Nous rappelons trois conditions fondamentales pour une utilisation optimale :
- Il faut bien identifier à qui s’adressent les rapports
- Il faut bien analyser les informations qu’ils donnent
- Il faut bien renseigner certaines données dans votre travail au quotidien, car c’est sur ces données que se basent les rapports
À qui s’adressent les rapports Jira ?
Les rapports Jira ne sont pas destinés à la direction de l’entreprise. L’objectif n’est pas de les utiliser pour définir la stratégie. Ils ne servent pas non plus pour la planification à long terme, ni pour l’analyse des interdépendances entre les projets. L’éditeur logiciel Atlassian propose par ailleurs des outils dédiés à ces usages (par exemple, Advanced Roadmaps, ou encore Jira Align).
Les rapports Jira s’adressent avant tout aux équipes Projet. Ils sont utiles à l’ensemble de l’équipe agile : Product Owner, développeurs et Scrum Master. Ces trois rôles ont pour objectif de suivre l’avancement du projet et l’adapter au besoin. Ainsi, les rapports Jira aident l’équipe à suivre ce qui est fait et ce qui reste à faire. C’est une photo du projet à l’instant « T ». L’équipe analyse ainsi cet ensemble d’informations pour en assurer l’amélioration continue.
Quelles informations trouve-t’on dans les rapports Jira ?
Les rapports Jira Software sont étroitement liés aux tableaux de suivi de projet agile et de leur paramétrage (filtres). Par exemple, si vous avez 3 tableaux distincts, un pour l’équipe A, un autre pour l’équipe B et un troisième, multi-équipe, pour le suivi des bugs, vous aurez des rapports très différents dans ces 3 tableaux.
Par ailleurs, vous n’obtiendrez pas les mêmes rapports en fonction du type de tableau agile Scrum ou Kanban, l’échelle de temps étant très différente entre ces deux tableaux. Dans la méthode Scrum, la contrainte temporelle est plus rythmée du fait des Sprints, contrairement au Kanban. Les rapports Scrum seront plus nombreux car ils seront soumis à cette contrainte.
Voici un exemple de rapport Kanban : Cumulative Flow Diagram
Le diagramme montre les statuts des demandes à travers le temps. Ce rapport aide surtout à identifier les goulots d’étranglement éventuels.
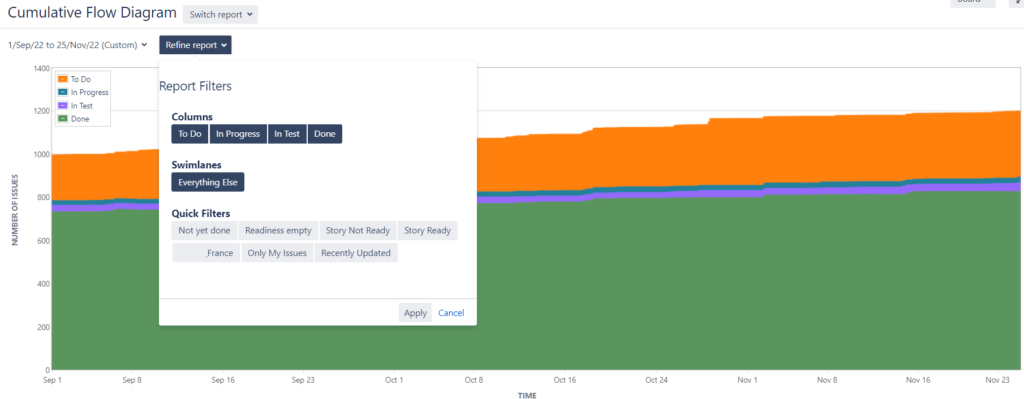
Dans ce rapport, on distingue le nombre total de demandes (plus de 1000), classées en fonction de leurs statuts. L’équipe a terminé plus de 700 demandes et il en reste 200 à adresser.
Par ailleurs, on voit qu’il s’agit d’un projet long avec un effectif réduit. En effet, le nombre de demandes en cours (« In Progress ») et en test (« In Test ») est bien inférieur à ce qui reste à faire. En revanche, il n’y a pas de goulot d’étranglement sur le projet : le nombre de requêtes « In Progress » et « In Test » reste stable.
Il est possible d’affiner ce rapport en fonction du temps, des statuts et des filtres rapides.
Exemples de rapports Scrum
Les rapports disposent des mêmes fonctionnalités lorsqu’on utilise des tableaux Scrum.
Rapport de Sprint
Voici deux exemples de rapports Jira de Sprint. Le premier correspondrait au rapport presque “idéal”. Le deuxième représente ce qu’on trouve souvent chez les utilisateurs de Jira.
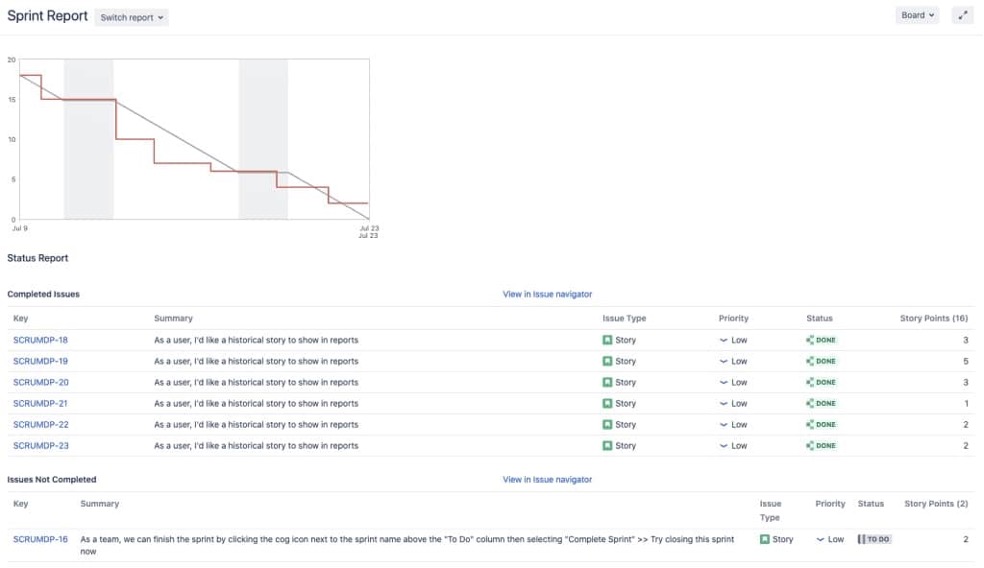
Dans les rapports, la courbe grise indique la quantité de travail estimée, la courbe rouge le travail réalisé. L’axe horizontal du graphique représente le temps, alors que l’axe vertical hiérarchise la valeur des demandes.
Sous le graphique, on trouve le détail du Sprint, à savoir :
- Les demandes terminées
- Les demandes en cours
- Les demandes sorties du Sprint
- Les demandes ajoutées au cours du Sprint
- Les demandes pour lesquelles on a modifié l’estimation
Pourquoi le premier exemple de rapport Jira est-il “idéal” ? La courbe de réalisation suit presque parfaitement la courbe prévisionnelle. L’équipe a même parfois été en avance. Elle a réalisé toutes les User Stories, exceptée une, durant le Sprint. Le seul bémol dans ce rapport est que la priorité est la même pour toutes les demandes, ce qui est impossible en réalité – il y a toujours des demandes plus prioritaires que d’autres.
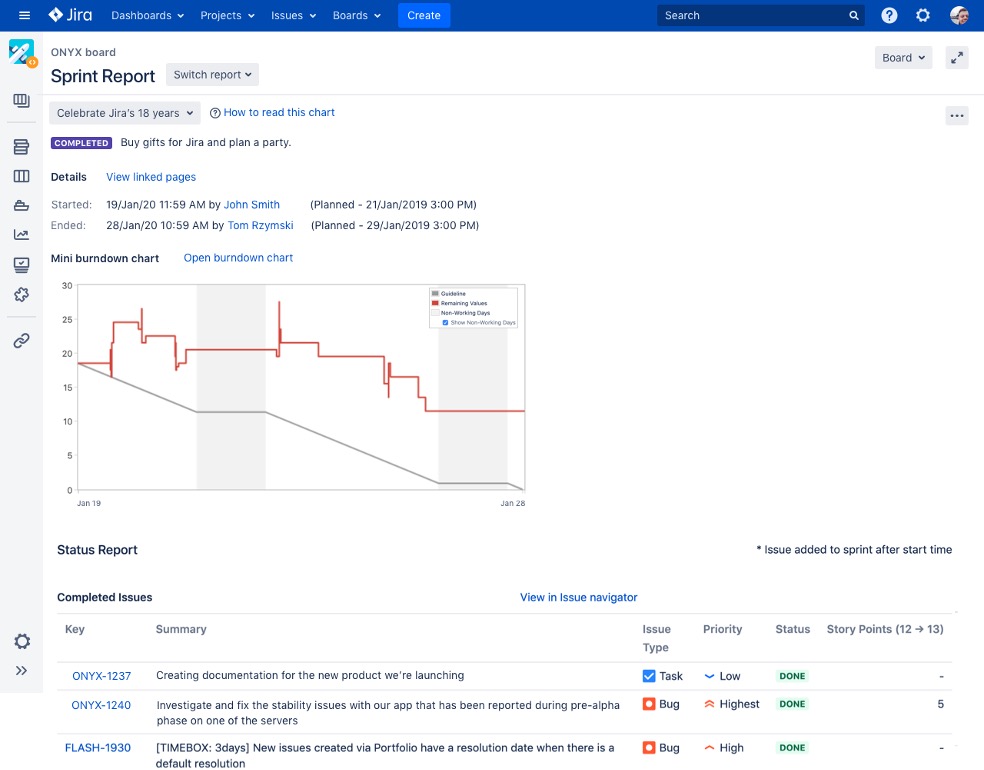
Le deuxième exemple montre un Sprint beaucoup plus mouvementé. Le graphique appelé Burndown chart indique que :
- L’équipe n’a pas réalisé la moitié des demandes planifiées (les courbes rouges et grises ne se rejoignent pas à la fin)
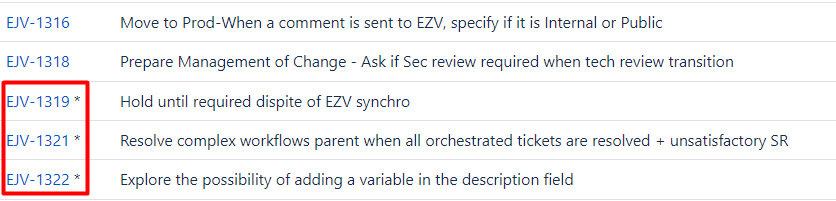
- L’équipe a ajouté des demandes non prévues en cours de sprint (identifiées sur la liste avec une étoile) et la courbe rouge repart vers le haut
- L’estimation de certaines demandes a été modifiée (ce qui est montré par dans la liste par les flèches) :
- Seule une partie des Bugs apparaît sous forme de nouvelle demande. Par principe, les Bugs ne devraient pas apparaître (ils n’apportent aucune valeur ajoutée et représentent, au contraire, une dette technique). Cependant, si l’équipe décide d’estimer les Bugs, elle doit rester cohérente et estimer tous les Bugs sans exception
Comment mieux utiliser les rapports Jira Software ?
Il est nécessaire de vérifier trois points :
- Pour les rapports Scrum et Kanban, il y a une subtilité qui concerne la résolution des demandes. Dans un tableau, une demande est considérée comme « terminée » quand elle se trouve dans la dernière colonne. Et ce, même si le champ « Résolution » est rempli. Ce point est essentiel.
- Utilisez les filtres pour affiner vos rapports.
- Pour les tableaux Scrum :
- a. Divisez bien votre Backlog en User Stories pour obtenir le niveau de détail nécessaire
- b. Estimez chacune des User Stories ou, à minima, paramétrez votre tableau pour compter le nombre de Stories. Cela est nécessaire pour les rapports de Sprint, ainsi que pour le Velocity Chart
- c. Positionnez les Stories sur le Sprint avant d’exécuter le rapport
- d. Maintenez la durée fixe des Sprints
- e. N’attendez pas le jour de la Sprint Review pour faire avancer les Stories
- f. Utilisez les Epics et les Versions pour pouvoir faire des prévisions
Conclusion : n’attendez pas pour utiliser les rapports agiles de Jira
Les rapports de Jira offrent un moyen très simple et peu couteux d’obtenir des indicateurs précieux sur l’activité de l’équipe : sa vélocité, le travail qu’elle a accompli pendant le Sprint, les goulots d’étranglement qu’elle peut rencontrer et bien plus encore !
Il vous suffit de les prendre en main : testez-les pour comprendre ce qu’ils peuvent apporter et soyez attentifs dans la saisie des informations nécessaires à ces rapports.
Pour aller plus loin : mieux utiliser les termes agiles dans Jira Software
Ces rapports Jira s’appuient sur des notions de base de la méthode Agile :
- Backlog
- User Story
- Epic
- Version
- Sprint
Il est primordial de comprendre et d’appréhender ces termes agiles, sans quoi les rapports Jira n’auront pas de sens.
Devenez familiers avec ces notions, passez de la théorie à la pratique dans Jira. La vidéo du Webinaire « Story, Epic, Sprint, Version: comment bien utiliser ces termes agiles dans JIRA software ? » à retrouver sur la chaîne Youtube SmartView !