Depuis de nombreuses années, Excel est l’outil numéro un de reporting. Adopté et ancré dans les usages des métiers et des directions, il est perçu comme l’outil de reporting le plus naturel pour compléter les rapports déjà présents dans les ERP ou les CRM.
Pourtant, l’outil possède des limites qui peuvent entrainer des désagréments et frustrations importantes dans la durée. Problème de fiabilité des données, absence d’unicité des indicateurs , déficit de performance et maintenance longue et coûteuse des macros viennent dégrader régulièrement l’usage de vos datas.
En termes de management et de pilotage, les concepteurs de tableaux de bord s’enferment très souvent dans l’utilisation de tableaux détaillés, certes très opérationnels, mais qui gênent la prise de recul ainsi que la priorisation.
Pour faire face à ces limites, de nombreuses entreprises s’orientent vers une alternative qui a désormais fait ses preuves, Power BI, l’outil décisionnel de Microsoft.
Pour illustrer ce propos, nous vous proposons de vous présenter le cas d’Aromandise, PME du sud de la France au succès national.
LA MUTATION DÉCISIONNELLE D’AROMANDISE
QUI EST AROMANDISE ?
Aromandise, c’est l’histoire d’une entreprise familiale qui a vu le jour en 1993 à Montpellier et qui compte désormais une trentaine de collaborateurs.
C’est une société qui commercialise des produits naturels bien-être et d’art de vivre associés au plaisir gustatif et olfactif. Preuve de leur travail de qualité, ils gagnent régulièrement des prix pour leurs produits. Ce fût notamment le cas pour leurs cristaux d’huiles essentielles, le café vert, leur Thé vert Matcha ou bien encore plus récemment leur sauce au carré curry japonais qui a reçu le prix de l’innovation culinaire BIO Natexpo 2020.
CHANGER POUR PASSER UN CAP ?
C’est également une entreprise qui a su évoluer grâce à l’analyse de ses données faites avec l’outil roi au royaume du reporting, vous l’aurez compris, Excel.
Pourtant, un jour, la direction a souhaité opérer un changement de CAP dans son outillage décisionnel. Deux principales raisons à cela :
- De nombreuses données présentes au sein de l’entreprise, inexploitées ou inexploitables.
- Un manque d’autonomie dans la conception des rapports qui étaient créés majoritairement par un des services. De fait, les délais de production des rapports étaient allongés et le service en question se retrouvait parfois en surcharge.
Attiré par l’outil nommé Power BI, Aromandise a décidé de contacter SmartView et voici, quelques semaines plus tard, les résultats.
Un tableau de bord complet, visuel et intéractif avec une zone de filtres à gauche et des indicateurs macro qui vous donnent un aperçu direct de l’état de santé de votre entreprise, comme l’atteinte des objectifs ou bien une baisse d’activité dans un secteur.

COMMENT EN SOMMES NOUS ARRIVÉS LÀ ? D’UN REPORTING SUR EXCEL AUX TABLEAUX DE BORD POWER BI
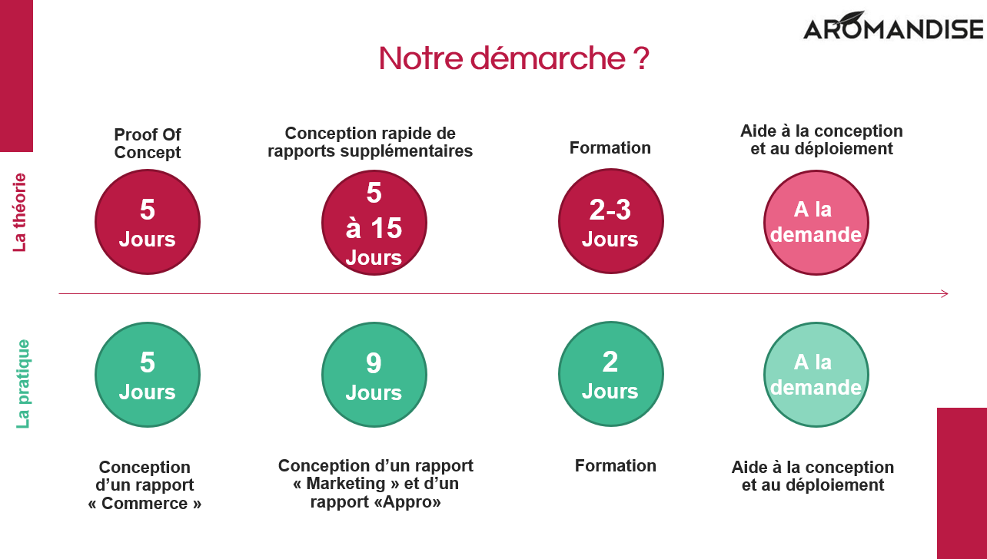
Il y a tout d’abord une démarche SmartView qui se déroule en 4 temps.
- Phase 1 : Valider les bienfaits de l’outil pour l’entreprise – Proof Of Concept (POC) où l’objectif est de se connecter aux données grâce à Power BI et faire la preuve à travers la construction d’un rapport, que l’outil répond bien aux attentes de l’entreprise – 5 jours
- Phase 2 : Accélérer la mise en place de votre décisionnel (optionnel) – Conception rapide de rapports supplémentaires permettant de bénéficier à différents niveaux de l’apport de votre nouvel outil décisionnel – Entre 5 et 15 jours
- Phase 3 : Vous conduire vers l’autonomie technique – Formation des utilisateurs à toutes les briques de l’outil – Entre 2 et 3 jours
- Phase 4 : Aider au déploiement, assistance technique et fonctionnelle – Mise en place d’une gouvernance de données, accompagnement dans les cadrages, rationalisation du décisionnel, aide technique à la production des rapports – A la demande
Ça c’est la théorie … mais quid d’Aromandise ?
- Etape 1 : conception d’un rapport pour le commerce sur les données issues de leur ERP – 5 jours
- Etape 2 : Production de deux tableaux de bord complémentaires – 9 jours
- Rapport pour le service marketing
- Rapport pour le service approvisionnement, plus complexe, permettant de calculer des prévisions de vente pour optimiser la gestion des stocks.
- Etape 3 : Formation prochainement dispensée à l’ensemble des équipes – 2 jours
QUELLES PLUS-VALUES DE POWER BI POUR LE CLIENT ?
Le client a perçu trois principales plus-values :
- Pouvoir exploiter de nouvelles données pour répondre à de nouvelles questions. Croiser les données clients et produits, travailler sur des comportements clients, calculer des prévisions ou préparer une négociation client avec une plus grande pertinence sont désormais possibles.
- Produire des rapports dans des délais plus courts.
- Etendre l’usage de la data au sein de l’entreprise puisque quasiment tous les services sont désormais consommateurs de rapports et peuvent intervenir dessus en modification.
FOCUS SUR LA PLUS-VALUE BUSINESS DE POWER BI
Voici quelques exemples de visuels désormais utilisés par les équipes sur les différents niveaux de pilotage :
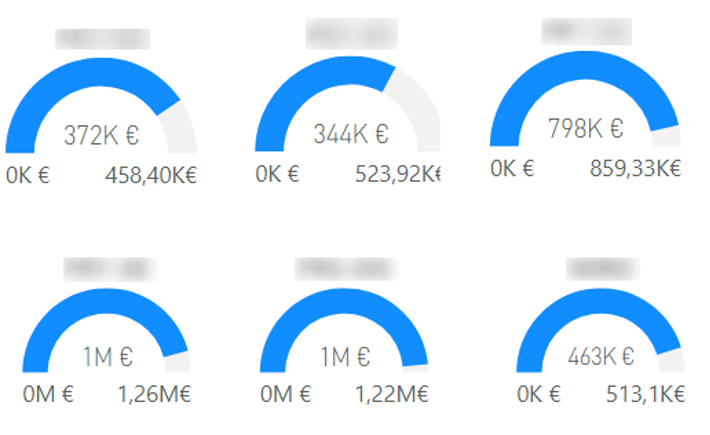
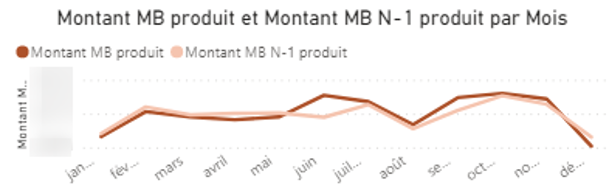
- Un nouveau pilotage macro
- Suivi rapide de l’atteinte des objectifs par un système de jauge
- Suivi du niveau de marge annuel versus celui de l’année précédente qui permet de visualiser et/ou anticiper les décrochages
- Un nouveau pilotage opérationnel
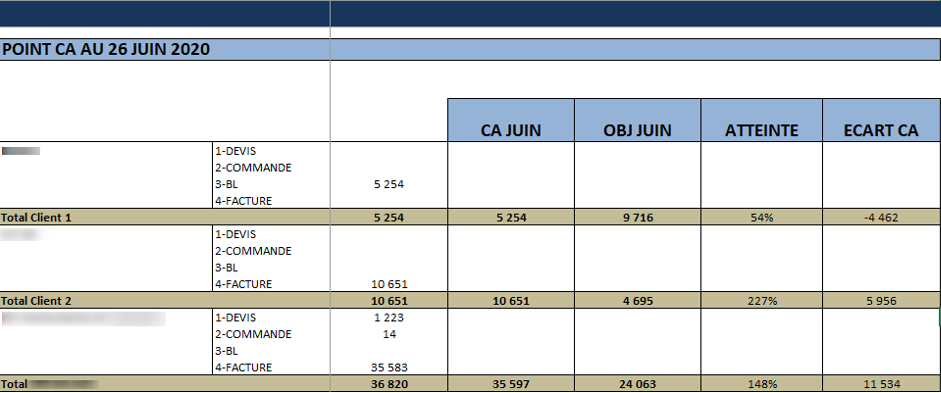
- Identification rapide des clients à potentiel ou en perte de vitesse. Nous comparons les données de l’année en cours à celle de l’année passée et nous calculons un top des clients en valeur absolue. Un travail similaire a été réalisé pour les produits.

LES CLÉS DU SUCCÈS ?
Pour parvenir à votre objectif, il serait mentir de dire que tout est simple. Je vous propose ci-dessous trois clés à incorporer dans la préparation pour que la mise en place de votre décisionnel soit un succès :
- Disposer d’un interlocuteur qui connaisse les éléments principaux de votre base de données.
- Identifier vos 2-3 utilisateurs clés car ce sont eux qui vont contribuer au succès de la mise en place de votre décisionnel. Ils seront les éléments centraux de votre décisionnel.
- Si l’outil permet d’aller vite, il ne faut pas précipiter le déploiement. Il faut au contraire laisser le temps à vos premiers utilisateurs et key users de prendre l’outil en main et se l’approprier car ils serviront de guides pour les contributeurs suivants.
LA SUITE ?
Le déploiement n’est pas encore terminé, la vitesse de croisière n’est pas atteinte et des marches sont encore à gravir.
Nous pensons notamment à la formation des collaborateurs, à l’élargissement du périmètre de données analysées ou bien au déploiement sur Power BI service pour que chaque collaborateur puisse consulter les rapports en ligne mais une chose est sûre, l’outil a été pris en main très rapidement par les collaborateurs et a apporté une vraie valeur ajoutée et une vraie satisfaction à Aromandise.
Nul doute que son déploiement contribuera à faire davantage grandir cette structure qui gagne à être connue !
Retrouvez sur notre chaîne Youtube notre webinaire consacré à PowerBI, qui comprend notamment des cas pratiques d’un tableau de bord des ventes.
Vous êtes curieux de savoir comment nous pouvons vous aider à mettre en place des tableaux de bord efficaces chez vous ?