Tous les articles de notre série “Mesurer l’agilité” :
- #1 Mesurer l’agilité : qu’est-ce que cela signifie ?
- #2 Mesurer l’agilité : une bonne idée ?
- #3 Mesurer l’agilité : quels pièges éviter ? (1)
- #4 Mesurer l’agilité : quels pièges éviter ? (2)
- #5 Mesurer l’agilité : que mesurer ? (1)
- #6 Mesurer l’agilité : que mesurer ? (2)
- #7 Mesurer l’agilité : le mot de la fin
Précédemment, dans la mesure de l’agilité…
Nous avons parlé de ce que signifie “mesurer l’agilité”, en nous basant sur une définition de ce que pouvait être l’agilité, qui était :
Une caractéristique propre à un individu, une équipe ou une organisation, qui est capable de s’adapter aux changements de son environnement, via :
- La livraison la plus régulière et fréquente possible de valeur, en fonction des attentes évolutives de ses utilisateurs et de son écosystème ;
- Un état d’esprit exemplaire favorisant la collaboration, l’autonomie et l’auto-organisation ;
- La recherche constante de la qualité et de l’amélioration dans ses activités et ses interactions.
Nous avons expliqué pourquoi il n’y a pas de raison de percevoir la mesure de l’agilité comme quelque chose de négatif ou d’antinomique avec les valeurs agiles. Cela peut nous aider à nous situer par rapport à une cible que nous nous fixons vis-à-vis de notre capacité à délivrer plus de valeur, collaborer, faire un travail de qualité… donc à nous améliorer.
Nous avons aussi parlé des pièges à éviter lorsque nous mettons en œuvre ce genre de pratiques. Par exemple : mesurer sans savoir pourquoi, céder à la tentation de tout vouloir contrôler, mettre en compétition les individus ou équipes entre eux… entre autres.
Ceci posé, que pouvons-nous mesurer, quels indicateurs agiles suivre et à quoi cela va-t-il nous servir ?
Indicateur d’agilité #1 : L’évolution de la valeur ajoutée perçue par les utilisateurs
Peter Drucker* aurait dit un jour que “rien n’est plus inutile que de produire efficacement quelque chose qui n’aurait pas dû être fait du tout”.
* Peter Drucker est un professeur en management américain (1909-2005) relativement connu. Il est décrit comme “le père du management moderne”.
Plus tard, nous mesurerons notre capacité à délivrer régulièrement de nouvelles solutions, de façon qualitative d’un point de vue de notre code. Mais cela nous permettra-t-il de savoir si nous répondons réellement aux besoins de nos utilisateurs ? Non. Pourtant, c’est essentiel.

Le graphique ci-dessus montre l’évolution classique d’une courbe de valeur ajoutée cumulée au fil du temps.
Au démarrage, nous allons avoir tendance à travailler sur des sujets indispensables au bon démarrage de notre produit, parfois moins riches en valeur pour les utilisateurs, tout en tâchant d’apporter malgré tout quelques fonctionnalités porteuses de valeur.
Après quelques semaines, nous devrions normalement travailler sur des sujets bien identifiés comme les plus importants pour nos utilisateurs.
Et au fil du temps, alors que nous avons traité les sujets les plus importants, ceux qui restent devraient, normalement, apporter une valeur ajoutée plus faible.
Pourquoi mesurer cet indicateur agile ?
C’est une mesure qui va permettre de savoir si nous allons, ou pas, dans la bonne direction vis-à-vis de ce qui paraît important aux personnes pour lesquelles nous travaillons. Des utilisateurs satisfaits, ce sont des utilisateurs qui vous seront fidèles, qui n’iront pas voir chez la concurrence. Ou qui iront voir pour d’autres raisons (comme le prix). Mais qui reviendront un jour si lesdits concurrents ne sont pas capables de se placer à leur niveau en comprenant leurs attentes.
Comment la mesurer ?
Il y a plusieurs possibilités. Cela peut être, par exemple, attribuer une valeur à chaque demande, avec l’aide d’un panel d’utilisateurs. Et comptabiliser chaque mois la valeur totale qui a été atteinte. Cela peut être également le fait de convier régulièrement les utilisateurs clés à une revue de produit. Et leur demander de noter ce qu’ils ont vu, du point de vue de la valeur ajoutée (beaucoup de valeur = une meilleure note). Il y sans aucun doute d’autres façons de faire.
Comment l’améliorer ?
Une valeur ajoutée perçue par les utilisateurs qui diminue au fil du temps peut être symptôme de plusieurs choses. Cela peut être parce que l’équipe a passé plus de temps à travailler sur des sujets à faible valeur ajoutée perçue. Par exemple, des sujets techniques : optimisation, correction d’anomalies… D’où l’intérêt de lisser ce type de sujets dans le temps autant que possible. Cela peut aussi être dû à une mauvaise compréhension des besoins. Que cela soit dans leur formulation, leur priorisation ou la réponse apportée. Ce qui devrait inciter l’équipe à collaborer de façon plus étroite avec ses parties prenantes.
Indicateur d’agilité #2 : L’évolution du temps de cycle
Qu’est-ce que le temps de cycle ? C’est la durée qui s’écoule entre le moment où nous commençons à travailler sur un sujet et le moment auquel il est considéré terminé.
Dans le cadre d’une démarche de développement logiciel, c’est généralement le délai qui s’écoule entre le moment où l’équipe commence à travailler sur un développement et sa mise à disposition sur l’environnement de production.
Dans le cadre d’une démarche d’un processus métier, non-IT, c’est le même raisonnement. Prenons l’exemple d’un département RH qui s’occupe de traiter des candidatures. Le temps de cycle pourrait être la durée écoulée entre le moment où le dossier du candidat commence à être examiné et la réponse définitive donnée au candidat.
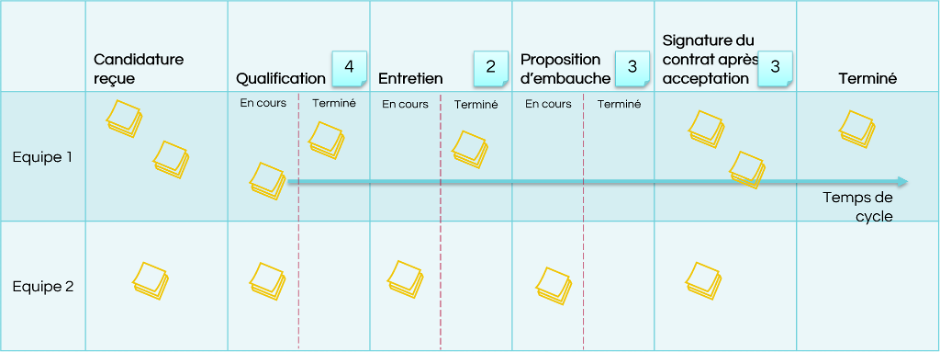
Il s’agit d’une durée : il s’exprime donc généralement en jours ou en heures. On peut tout à fait considérer le temps de cycle de chaque demande de façon indépendante. Mais il est plus intéressant de visualiser le temps de cycle moyen d’une équipe, voire d’un type de demandes. Cela permet de visualiser comment il évolue au fil du temps.
Pourquoi le mesurer ?
Un meilleur temps de cycle aide à obtenir un meilleur temps de traversée (voir ci-dessous).
Comment le mesurer ?
Pour chaque demande, il suffit de noter la date de début du travail sur le besoin exprimé. Puis de noter la date de mise à disposition à l’utilisateur, et de faire la différence entre les deux.
Comment l’améliorer ?
Pour cela, on peut réduire plusieurs choses :
- les délais dans la prise de décision,
- les délais dus aux blocages dans le processus de travail,
- les allers-retours inutiles.
C’est un premier axe qui permet d’obtenir de sérieux gains, car la demande va plus rapidement aller à son terme. C’est une des raisons pour lesquelles l’auto-organisation et l’autonomie des équipes et la composition d’équipes cross-fonctionnelles sont mises en avant dans les approches agiles : pour assurer une meilleure réactivité.
Automatiser un certain nombre d’opérations chronophages, telles que les tests, aide également. Cela permet un gain de temps et diminue le risque d’erreurs.
Indicateur d’agilité #3 : L’évolution du temps de traversée
Le temps de traversée (que vous connaissez peut-être dans sa version anglaise, “lead time”) est, de la façon la plus générique possible, la durée qui s’écoule entre le début d’un processus et sa complétion.
Dans le cadre d’une démarche de développement logiciel, c’est généralement le délai qui s’écoule entre l’expression d’un besoin par un utilisateur et sa mise à disposition sur l’environnement de production. Et si nous reprenons notre département RH, quel serait le temps de traversée ? Cela pourrait être la durée écoulée entre la réception de la candidature et la réponse définitive donnée au candidat.

Le temps de cycle est donc inclus dans le temps de traversée. Un temps de cycle plus court aidera à obtenir un temps de traversée plus court. Le temps de traversée se compose, en plus, de la durée qui s’écoule pendant laquelle la demande est dans une file d’attente. C’est-à-dire, attendant son traitement, mais qui n’est pas traitée. D’où l’intérêt, pour plus de réactivité, d’être également capables de réduire la longueur de cette file d’attente.
Pourquoi le mesurer ?
Un meilleur temps de traversée signifie une réponse plus rapide à un besoin exprimé par un utilisateur. Cela suppose donc une capacité à livrer plus régulièrement de la valeur, ce qui était un des axes de notre définition de l’agilité vue précédemment.
Comment le mesurer ?
Pour chaque demande, il suffit de noter la date de l’expression du besoin par l’utilisateur à l’équipe. Puis de noter la date de mise à disposition à l’utilisateur. Enfin, il suffit de faire la différence entre les deux.
Comment l’améliorer ?
Pour améliorer le temps de traversée, il est important d’améliorer le temps de cycle (voir ci-dessus). Il faut aussi arriver à réduire la durée pendant laquelle la demande reste à l’état de demande exprimée, mais sur laquelle aucun travail n’a encore été entrepris. Pour cela, réduire la longueur de la file d’attente (le backlog) est une possibilité. Cela permet de rejeter les idées qui ne sont pas suffisamment porteuses de valeur pour se concentrer sur l’essentiel.
La suite au prochain épisode
Nous aborderons trois indicateurs agiles supplémentaires dans notre prochain article. Restez connectés pour être mis au courant des prochains articles sur le sujet.